

Independent research on markets, rates and the AI buildout.
A chart every weekday. Two letters a week. The data shown, every source cited.
We use your address only to send The Signal. Unsubscribe any time. Privacy
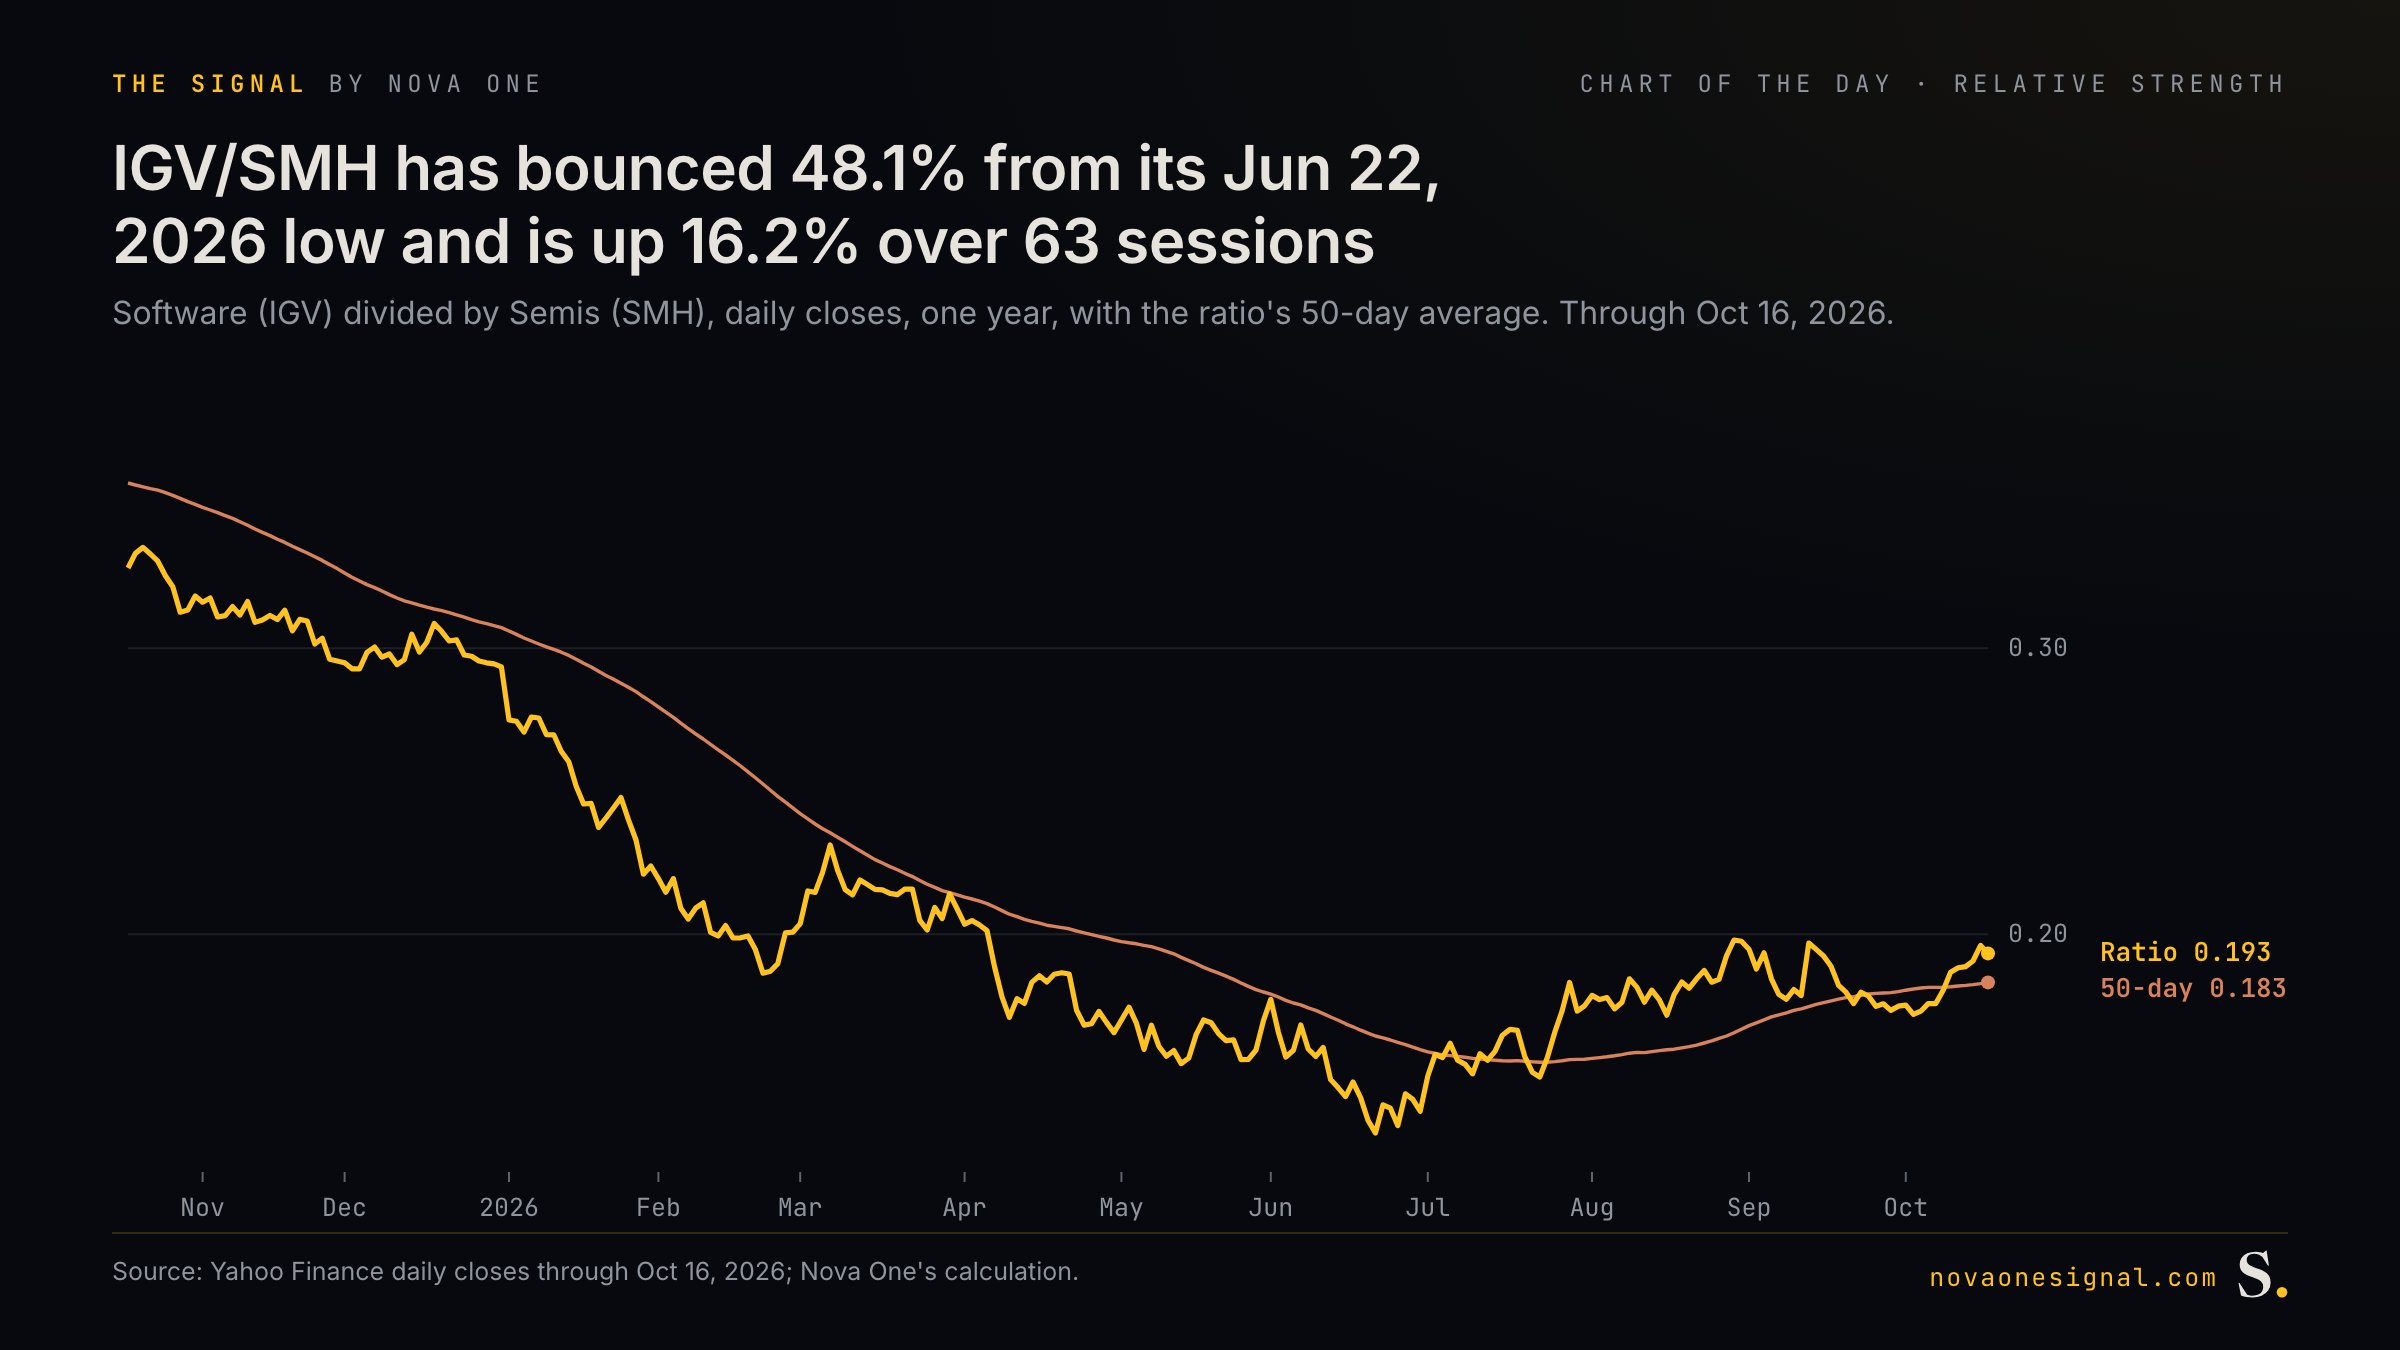
IGV/SMH has bounced 48.1% from its Jun 22, 2026 low and is up 16.2% over 63 sessions
Chamath says open source clones make software IP and moats worthless, and the ratio is still 42.3% below its Oct 22, 2025 peak. But IGV/SMH sits above its 50-day average and has gained 16.2% in 63 sessions, so the lag is the one-year story and the recent tape is a catch-up.
One line divides Software (IGV) by Semis (SMH). When it rises, IGV is beating SMH; when it falls, SMH is winning, whatever the market as a whole is doing. The second line is the ratio's own 50-day average, its trend.
If software moats were really worthless, this ratio should keep sliding, and a 48.1% rebound from the Jun 22 low says the market isn't pricing that right now. Watch the 50-day average: a drop back below it would put the one-year lag back in charge.
Chamath on All-In: open source decompiled clones of Adobe's core products mean software IP and moats are worthless.
All-In Podcast, Chamath PalihapitiyaIGV/SMH is 42.3% below its Oct 22, 2025 peak, 48.1% above its Jun 22, 2026 low, above its average, up 16.2% over 63 sessions.
The lag is real over the year, but the ratio has turned up and the current trend runs against the claim.
From the letters
Our AI Desk Tried to Put Words in Chamath's Mouth
What happens when you reward a machine for finding the consensus wrong, and the eight-word rule that stops it.
- Week in ReviewThe Weak LinkOctober 17, 2026
- Mid-Week Check-InMemory Takes the HitOctober 14, 2026
- Week in ReviewThe Clearing PriceOctober 10, 2026
Recent charts
What we publish
Letters on the macro tape, market regimes, geopolitics and the theses we hold, with the data shown and every source cited. Published by Nova One Capital, from the research behind the Nova X Convergence Fund, which puts its own capital behind the work.
- Chart of the Day
- WeekdaysOne chart that tests what the market is saying, with the consensus, the data and our read side by side.
- Mid-Week Check-In
- WednesdaysThe tape between letters: the data, the prints and the moves worth a second look.
- Week in Review
- SaturdaysWhat the week changed in markets, and what it did not: the tape, the rates picture, and where our theses stand.
- Desk Notes
- WeeklyInside the AI research desk behind The Signal: how every claim is tested and every chart is built.
By email
We use your address only to send The Signal. Unsubscribe any time. Privacy